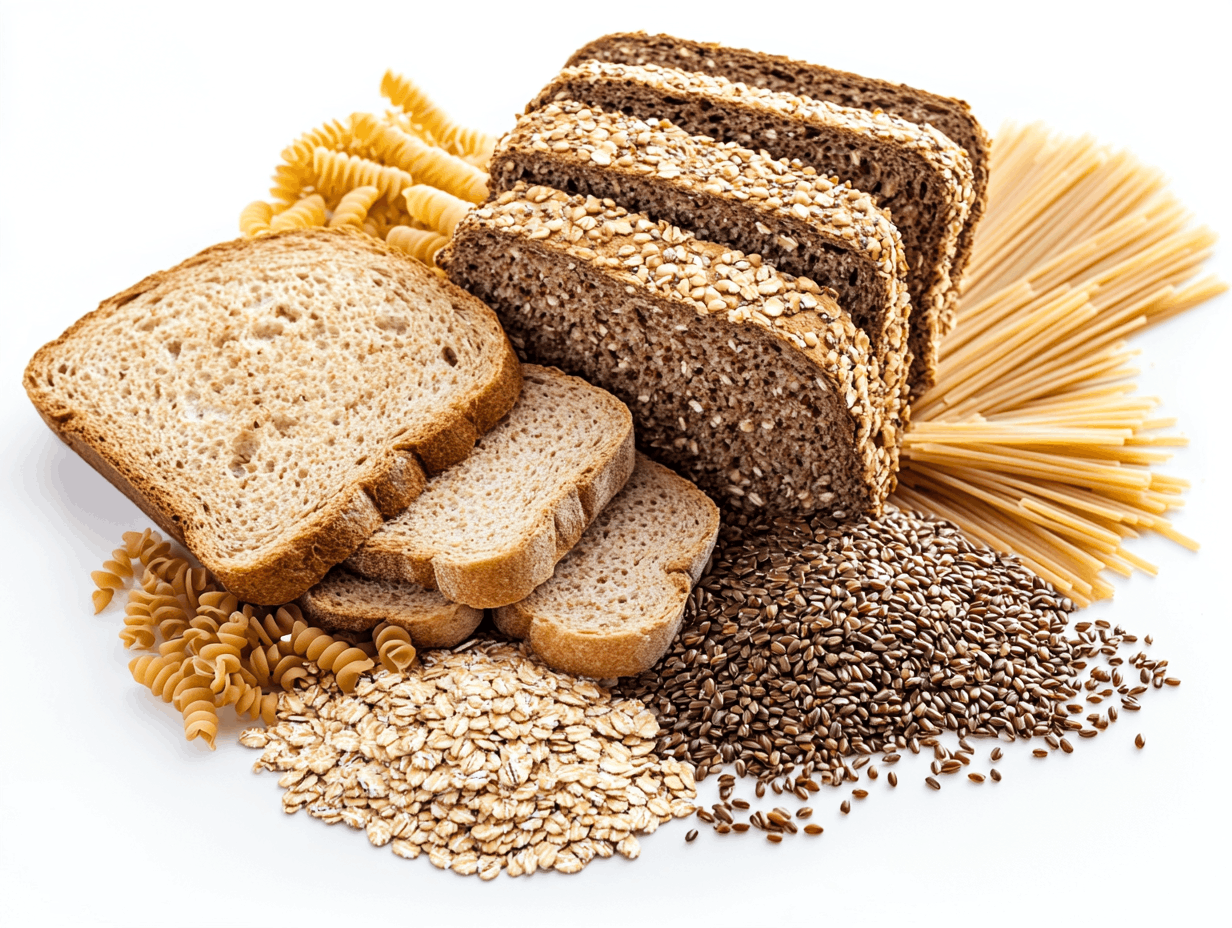
Calories in Grains
Rice, pasta, bread, oats, quinoa, and more. Full calorie data for every grain, straight from the USDA database. Look up calories per 100g or per serving, dry and cooked, in metric or imperial.
Rice, pasta, bread, oats, quinoa, and more. Full calorie data for every grain, straight from the USDA database. Look up calories per 100g or per serving, dry and cooked, in metric or imperial.
| Food | Serving | Calories |
|---|---|---|
| White Rice, Cooked | 1 cup (186g) | 130 Cal |
| White Rice, Dry (uncooked) | 1/4 cup dry (45g) | 365 Cal |
| Brown Rice, Cooked | 1 cup (195g) | 123 Cal |
| Basmati Rice, Cooked | 1 cup (163g) | 121 Cal |
| Pasta, White, Cooked | 1 cup (140g) | 158 Cal |
| Pasta, Wholegrain, Cooked | 1 cup (140g) | 124 Cal |
| Pasta, White, Dry (uncooked) | 2 oz dry (56g) | 371 Cal |
| Oats, Rolled (Dry) | 1/2 cup dry (40g) | 389 Cal |
| Porridge / Oatmeal, Cooked | 1 cup (234g) | 71 Cal |
| Bread, White | 1 slice (30g) | 265 Cal |
| Bread, Wholegrain | 1 slice (32g) | 247 Cal |
| Bread, Sourdough | 1 slice (35g) | 232 Cal |
| Bread, Rye | 1 slice (32g) | 259 Cal |
| Quinoa, Cooked | 1 cup (185g) | 120 Cal |
| Couscous, Cooked | 1 cup (157g) | 112 Cal |
| Barley, Pearled, Cooked | 1 cup (157g) | 123 Cal |
| Buckwheat, Cooked | 1 cup (168g) | 92 Cal |
| Bulgur Wheat, Cooked | 1 cup (182g) | 83 Cal |
| Millet, Cooked | 1 cup (174g) | 119 Cal |
| Spelt, Cooked | 1 cup (194g) | 127 Cal |
| Farro, Cooked | 1 cup (200g) | 130 Cal |
| Polenta (Cornmeal), Cooked | 1 cup (240g) | 70 Cal |
| Cornmeal, Dry | 1/4 cup (34g) | 362 Cal |
| Pita Bread, White | 1 pita (58g) | 275 Cal |
| Tortilla, Flour (25cm) | 1 tortilla (45g) | 312 Cal |
| Tortilla, Corn | 1 tortilla (26g) | 218 Cal |
| Rye Crispbread / Cracker | 2 crackers (22g) | 357 Cal |
| Granola, Plain | 1/2 cup (61g) | 471 Cal |
| Muesli, Unsweetened | 1/2 cup (50g) | 363 Cal |
| Corn Flakes | 1 cup (28g) | 357 Cal |
| Egg Noodles, Cooked | 1 cup (160g) | 138 Cal |
| Rice Noodles, Cooked | 1 cup (176g) | 109 Cal |
| Wheat Flour, White (All-purpose) | 1/4 cup (30g) | 364 Cal |
| Wheat Flour, Wholegrain | 1/4 cup (30g) | 340 Cal |
Data source: USDA FoodData Central. Values are approximate and may vary by brand, variety, and cooking method. Cooked values assume cooking in water with no added fat or salt unless otherwise noted.
The most important thing to understand about tracking grain calories is the difference between dry and cooked values. Grains absorb a significant amount of water during cooking, which dramatically changes their calorie density per gram. Dry white rice contains 365 calories per 100g, but the same rice cooked contains only 130 calories per 100g — the grain has absorbed approximately 2 to 3 times its weight in water. This means if you track dry values for cooked rice, you will dramatically overestimate your calorie intake.
Always match your tracking method to the state of the food: if you weigh rice after cooking, use cooked values. If you weigh pasta before cooking, use dry values. Both methods work well, but mixing them causes large errors. For most people, weighing after cooking is more practical since you can portion food accurately before eating.
Among cooked grains, the calorie range is surprisingly narrow. Most cooked grains fall between 70 and 160 calories per 100g. The bigger differences come from fibre, protein, and glycaemic index. Wholegrains like brown rice, wholegrain pasta, quinoa, and bulgur wheat offer more fibre and nutrients than their refined counterparts with similar or fewer calories. Granola and dry cereals appear high-calorie because they are dry foods with concentrated calorie density — a cup of granola contains far more calories than a cup of cooked rice.
Wholegrains retain the bran, germ, and endosperm of the grain kernel, while refined grains have the bran and germ removed, leaving only the starchy endosperm. This process removes most of the fibre, B vitamins, vitamin E, and minerals. The practical impact: wholegrain pasta has 3.9g of fibre per 100g cooked versus 1.8g for white pasta; wholegrain bread has 6.9g of fibre per 100g versus 2.7g for white bread. Higher fibre means slower digestion, greater satiety, and more stable blood sugar after eating.
Browse calories and macros across all food groups in our USDA-backed nutrition database.
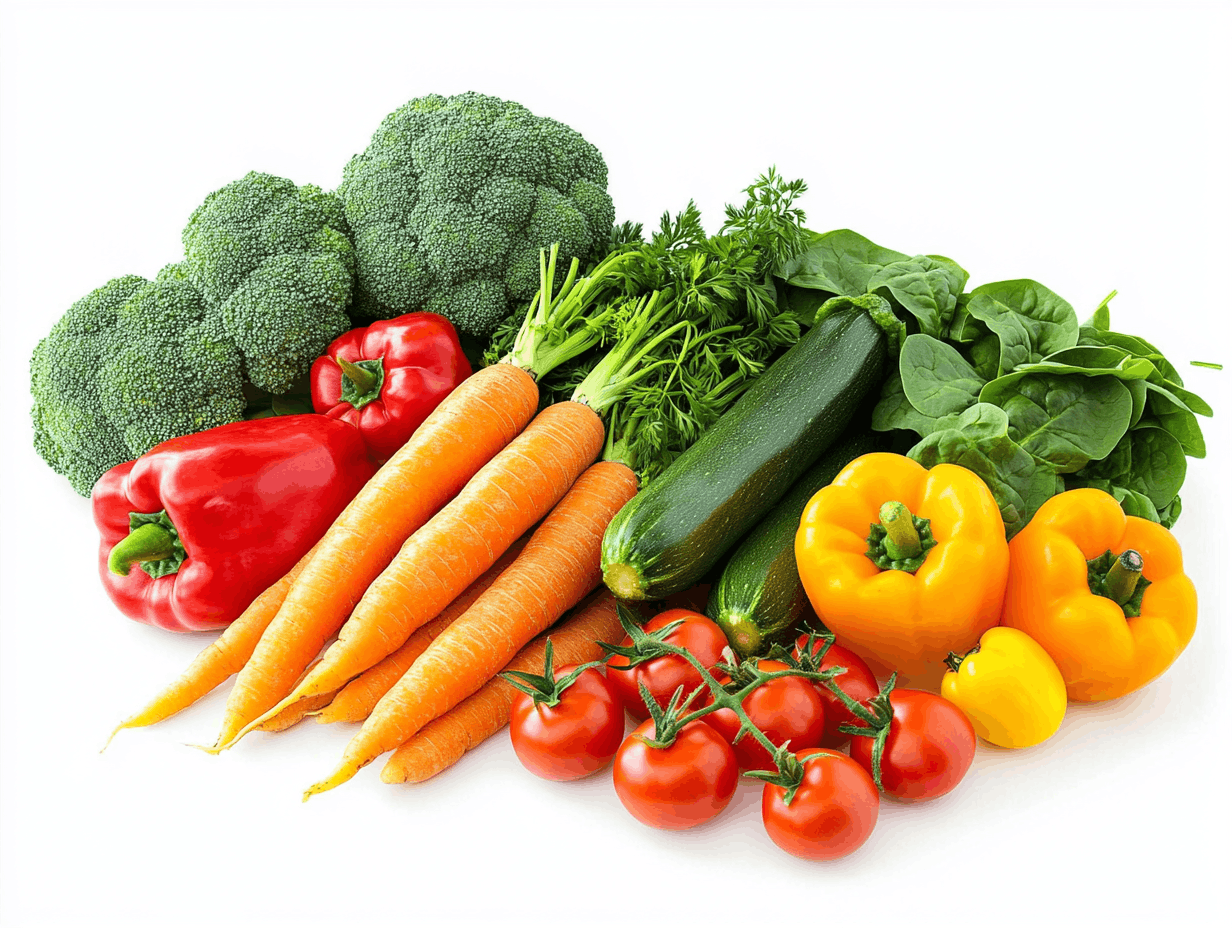
From leafy greens to root vegetables, explore calorie data for every vegetable. Compare raw and cooked values across broccoli, spinach, sweet potato, and more.
See calories for vegetables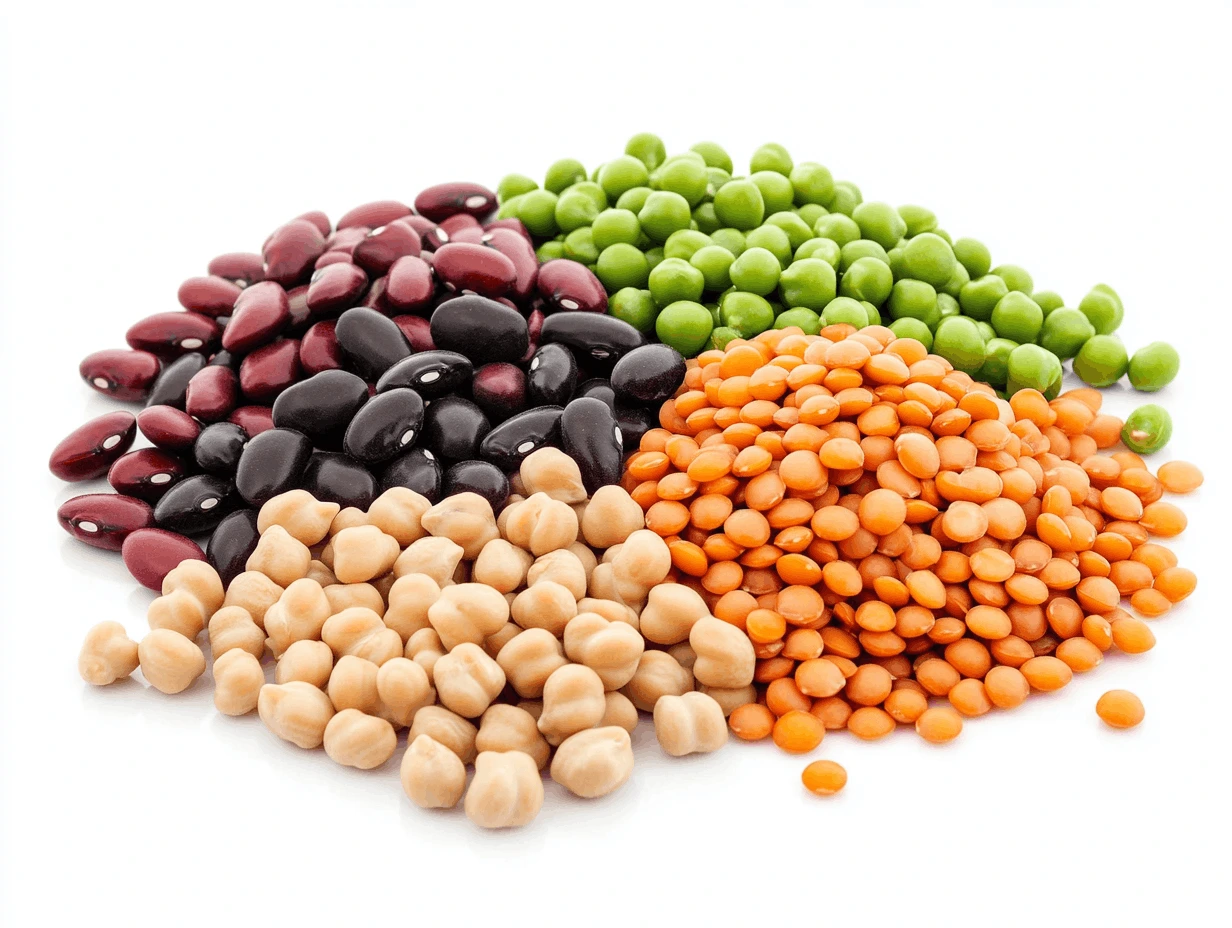
Beans, lentils, and chickpeas pack serious protein and fiber. Compare calories and macros across varieties to find the best plant-based protein sources.
See calories for legumes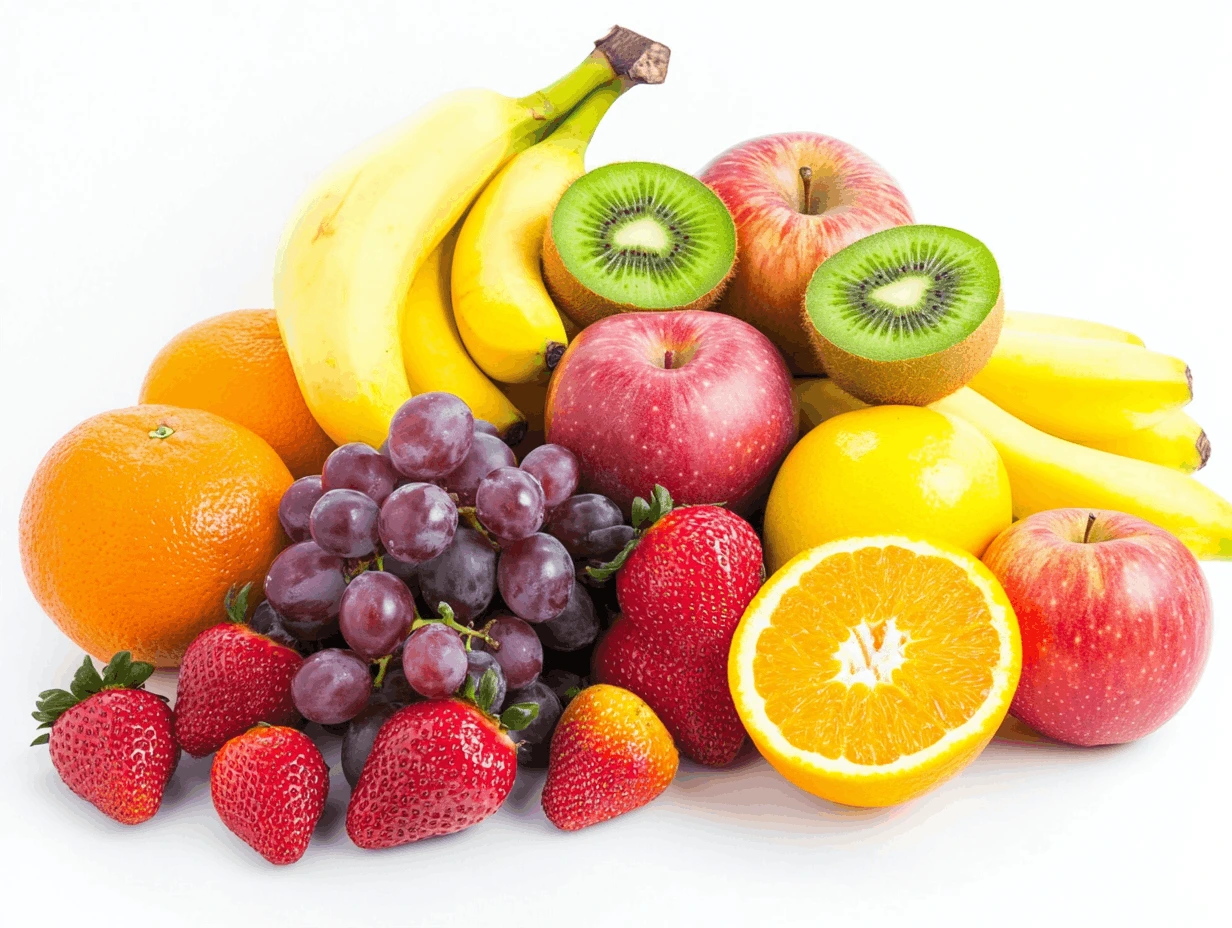
From berries to tropical fruits, get full calorie data for every fresh and dried fruit. Compare low-sugar options and track portions with ease.
See calories for fruits
Milk, yogurt, and cream offer calcium and protein in every serving. Compare full-fat vs. low-fat options and track macros across your favourite dairy staples.
See calories for dairy products
A complete protein source with essential amino acids, vitamins, and healthy fats. Track calories by whole egg, white, or yolk across different preparation methods.
See calories for eggs
Calorie-dense and rich in healthy fats, nuts and seeds make every gram count. Compare protein, fat, and carb content across varieties to optimize snacking.
See calories for nuts & seeds
Chicken, turkey, duck, and more. Full nutritional data for every cut. Compare calories and protein across lean and fatty poultry options.
See calories for poultry
Salmon, tuna, cod, shrimp, and more. Full calorie data for every fish and seafood type, raw and cooked, straight from the USDA database.
See calories for fish & seafood
From lean ground beef to richly marbled ribeye, explore calorie data for every beef cut. Compare raw and cooked values for accurate tracking.
See calories for beefGet the numbers that actually matter for your health. From body composition to daily calorie targets, our calculators give you a clear, personalized starting point. No account needed.
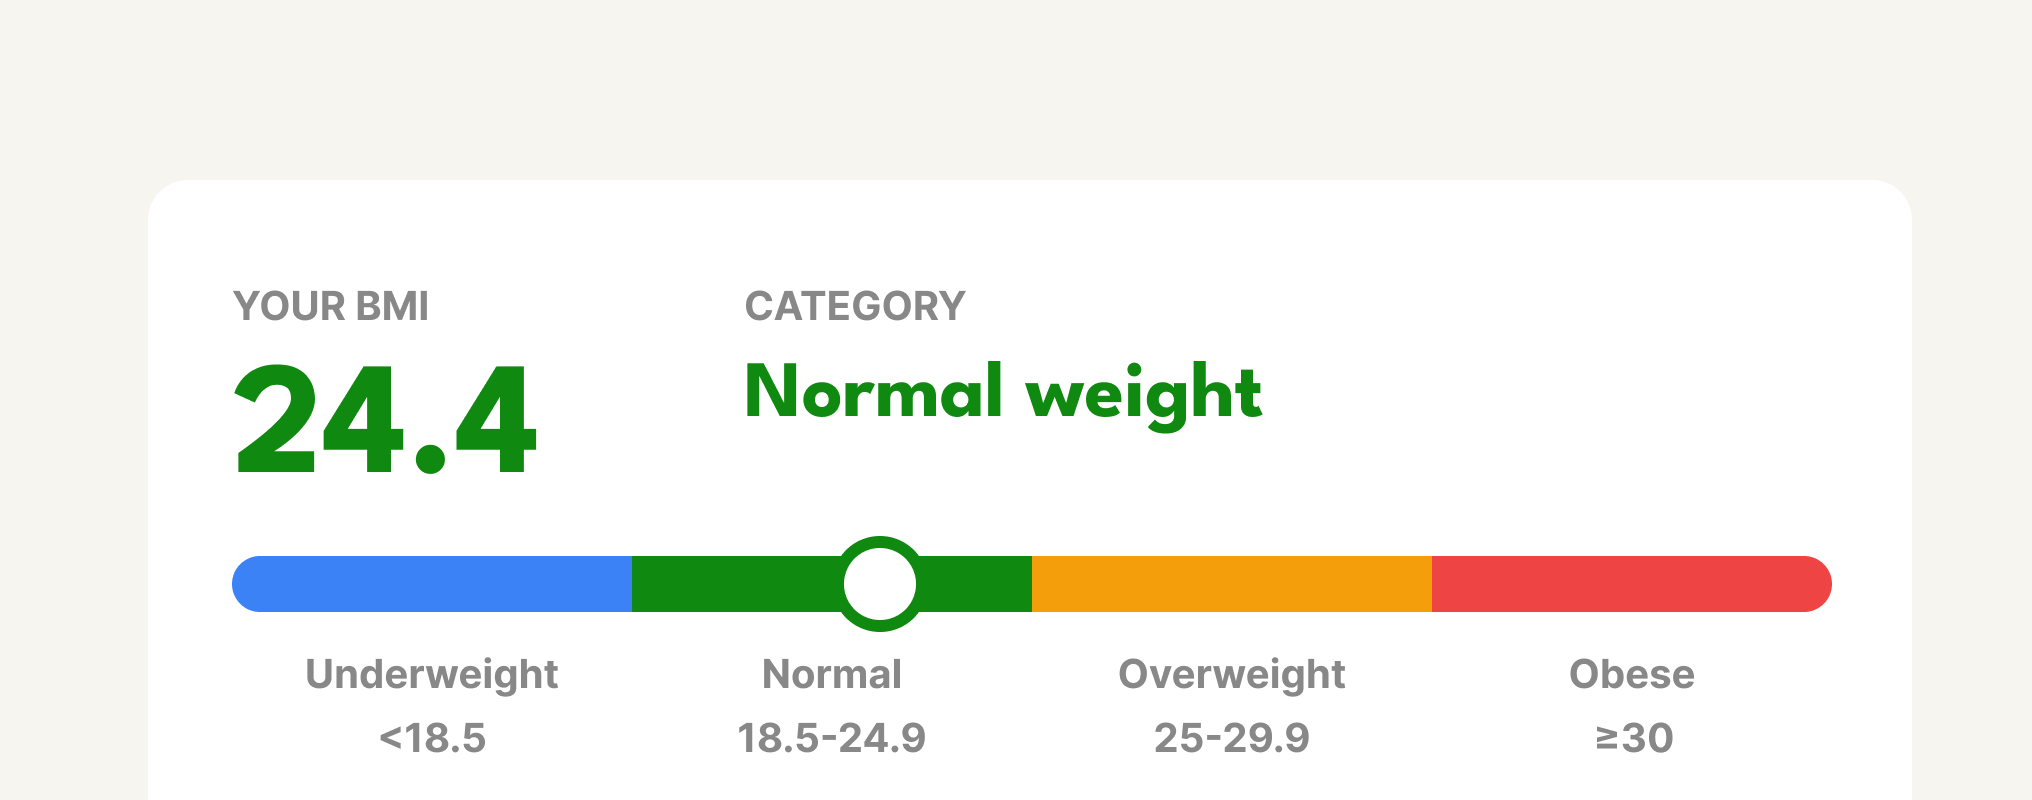
Find out if your weight is in a healthy range for your height. A quick first step to understanding your body and setting realistic health goals.
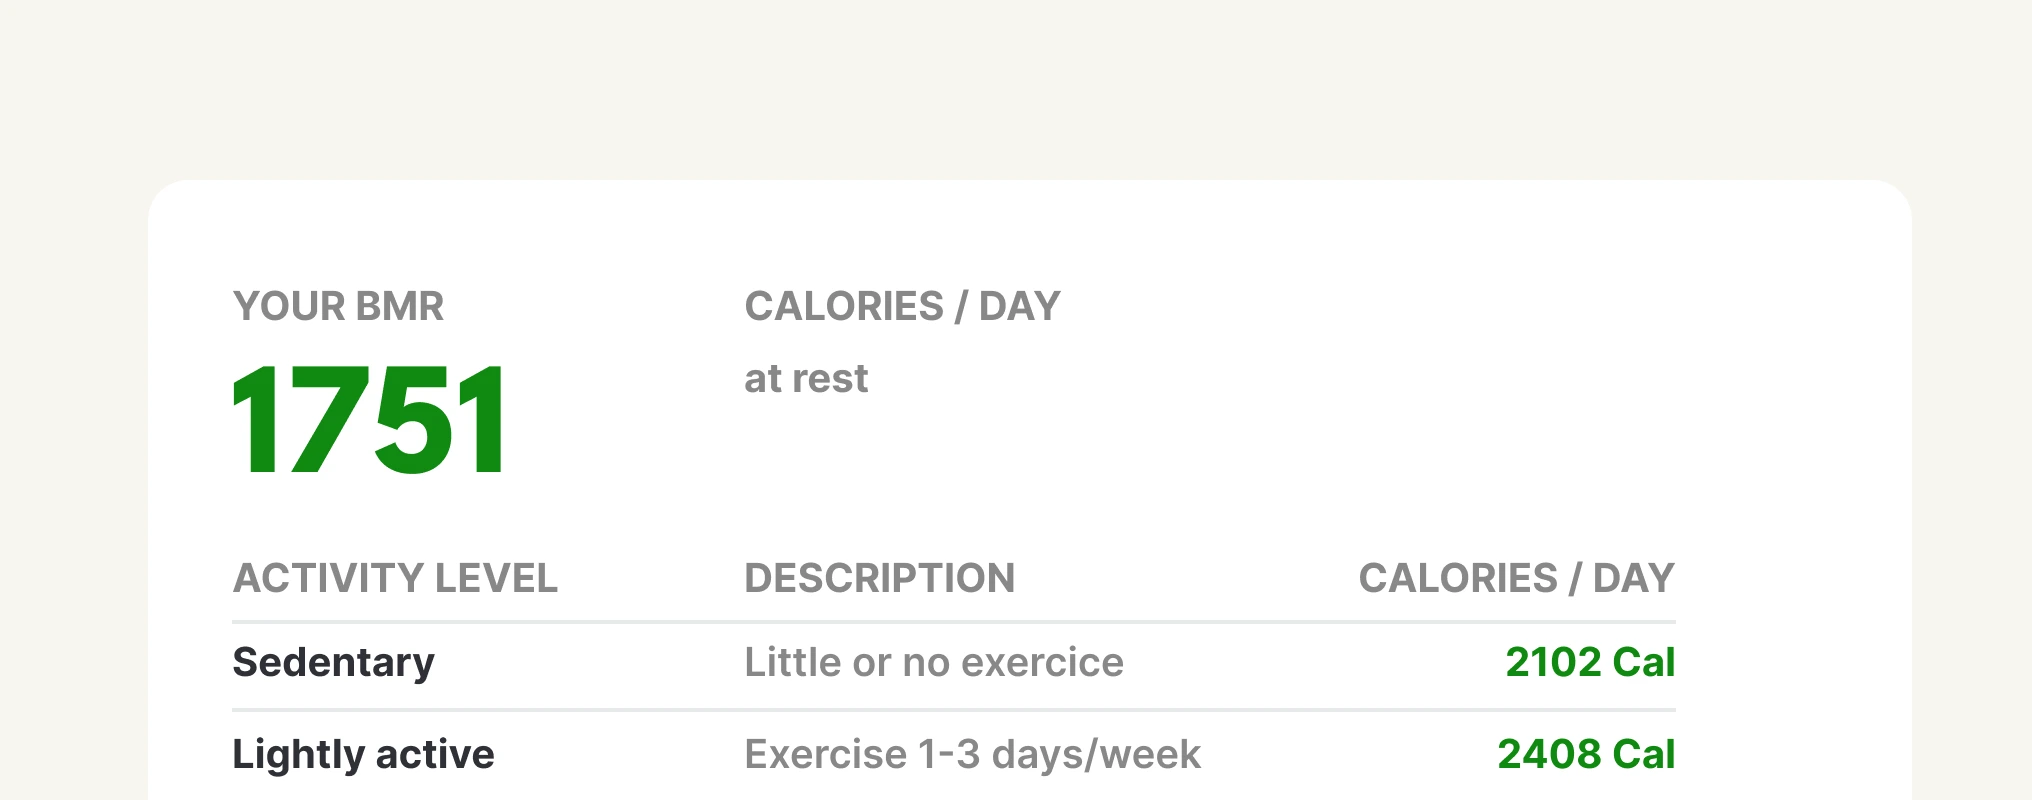
Discover how many calories your body burns at complete rest. Your BMR is the foundation of any smart nutrition or weight management plan.
Get the exact number of calories your body needs based on your weight, height, age, and activity level.
Find your ideal protein, carb, and fat targets based on your goals. Whether you're cutting, bulking, or maintaining, get a macro split tailored to you.
Cooked white rice contains approximately 130 calories per 100g with 28.2g of carbohydrates. A 1 cup (186g) serving contains approximately 242 calories. Brown rice is slightly lower at 123 calories per 100g cooked with more fibre at 1.6g. Dry uncooked white rice is 365 calories per 100g — always track by cooked weight to avoid overestimating intake.
Cooked white pasta contains approximately 158 calories per 100g with 30.9g of carbohydrates and 5.8g of protein. A 1 cup (140g) serving provides approximately 221 calories. Wholegrain pasta is lower at 124 calories per 100g cooked with significantly more fibre at 3.9g per 100g. Dry pasta is 371 calories per 100g — always track pasta by cooked weight for accuracy.
White bread contains approximately 265 calories per 100g with a standard slice (30g) providing approximately 80 calories. Wholegrain bread is slightly lower at 247 calories per 100g but much higher in fibre at 6.9g per 100g. Sourdough contains approximately 232 calories per 100g with a lower glycaemic index. Rye bread provides 259 calories per 100g with 5.8g of fibre.
Dry rolled oats contain approximately 389 calories per 100g with 16.9g of protein — one of the highest protein grains. A standard 1/2 cup (40g) dry serving contains approximately 156 calories. Cooked porridge made with water drops to around 71 calories per 100g due to water absorption. A 1 cup (234g) bowl of plain porridge contains approximately 166 calories and is one of the most satiating breakfast options available.
Cooked white pasta is slightly higher at 158 calories per 100g versus cooked white rice at 130 calories per 100g. However, a typical cup serving of rice (186g) provides 242 calories, similar to a cup of pasta (140g) at 221 calories since rice is served in larger portions. Wholegrain pasta at 124 cal/100g is actually lower in calories than white rice and much higher in fibre.
Cooked quinoa contains approximately 120 calories per 100g with 21.3g of carbohydrates, 4.4g of protein, and 2.8g of fibre. A 1 cup (185g) serving contains approximately 222 calories with 8.1g of protein. Quinoa is a complete protein containing all nine essential amino acids and is naturally gluten-free — making it a more nutritionally complete carbohydrate than most other grains.
Always match your method to the food state: use cooked values when weighing cooked food, dry values when weighing dry. Mixing them causes large errors. White rice is 365 cal/100g dry but only 130 cal/100g cooked. For most people, weighing after cooking is most practical. When meal prepping, weighing dry and dividing into equal portions is more consistent across meals.
Cooked couscous contains approximately 112 calories per 100g with 23.2g of carbohydrates and just 0.2g of fat. A 1 cup (157g) serving contains approximately 176 calories. It is one of the lowest-fat cooked grains and very quick to prepare. Its fibre content is modest at 1.4g per 100g — lower than wholegrains like bulgur or quinoa, and it has a relatively high glycaemic index.
Cooked bulgur wheat contains approximately 83 calories per 100g with 18.6g of carbohydrates and an impressive 4.5g of fibre — one of the highest-fibre cooked grains. A 1 cup (182g) serving provides approximately 151 calories with 8.2g of fibre. Its low glycaemic index makes it one of the best grain choices for blood sugar control and sustained energy.
Wholegrains support weight management primarily through their higher fibre content, which slows digestion, increases satiety, and helps regulate blood sugar. The calorie difference is modest — wholegrain pasta at 124 cal/100g versus white at 158 cal/100g — but the satiety difference is significant. Research consistently shows better long-term weight management in people who prioritise wholegrains over refined ones.
Plain granola contains approximately 471 calories per 100g with 64.4g of carbohydrates and 20.1g of fat. A 1/2 cup (61g) serving contains approximately 287 calories. Despite its health reputation, granola is calorie-dense due to added oils and sugars. Always check labels as values vary widely between brands. Compare this to plain porridge at 71 calories per 100g cooked — a dramatically lower-calorie breakfast option.
A flour tortilla (25cm, 45g) contains approximately 140 calories with 23.2g of carbohydrates. A corn tortilla (26g) is lower at approximately 57 calories with higher fibre at 6.3g per 100g. Corn tortillas are significantly lower in calories, fat, and refined carbohydrates than flour tortillas, and are naturally gluten-free — the better choice for calorie-conscious eating.
Cooked pearled barley contains approximately 123 calories per 100g with 28.2g of carbohydrates and 3.8g of fibre. A 1 cup (157g) serving contains approximately 193 calories. Barley has a very low glycaemic index and is rich in beta-glucan fibre, associated with reduced LDL cholesterol. It is one of the most satiating grains due to its high fibre and water-absorbing properties.
Among cooked grains, polenta (cooked cornmeal) is one of the lowest at approximately 70 calories per 100g, followed by porridge at 71 calories per 100g. Bulgur wheat (83 cal/100g) and buckwheat (92 cal/100g) are also very low. These compare favourably to cooked white rice at 130 cal/100g and white pasta at 158 cal/100g. However, portion size and overall dietary patterns matter more than choosing between individual grain types.
Use a kitchen scale rather than cup measurements — volume estimates vary significantly by how loosely or tightly packed the grain is. Weigh after cooking and use cooked values for the most practical approach. For bread and crackers, weigh individual slices. Always check whether nutrition labels show dry or cooked values — the difference is substantial. For consistent meal prep, weigh dry, cook a full batch, then divide into equal portions.